U.S. economy losing steam, but that won’t stop the Fed from raising rates
Market summary
U.S. equities were mostly higher this week, after the S&P 500, Dow Jones and Nasdaq ended the prior week lower. Sector performance was mixed as communication services and technology outperformed the most and utilities and industrials underperformed the most. Treasuries were stronger, with the two-year yield falling to 3.85% midweek and ending slightly above 4%. The dollar index ended the week weaker.
This week
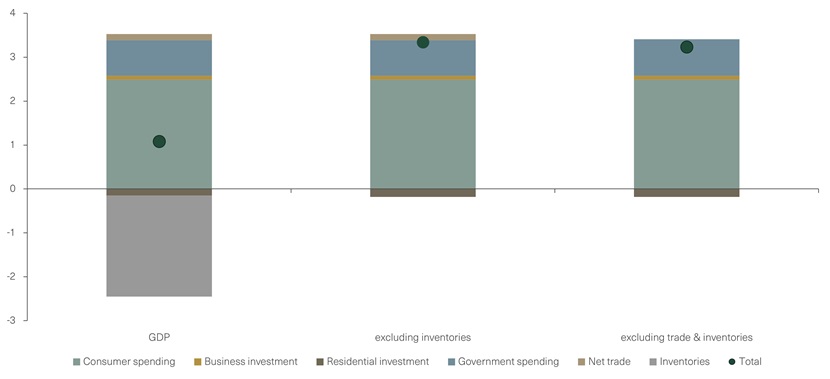
Economic growth continued to slow in the beginning of 2023. The first preliminary reading of the first-quarter (Q1) gross domestic product (GDP) increased by 1.1% quarter over quarter (QoQ) after increasing by 2.6% in Q4 2022 (see Figure 1). However, this report was impacted by seasonal factors and a boost to consumer spending thanks to warmer weather. We expect that growth will slow further in the upcoming months as credit conditions tighten, interest rates remain high and high inflation continues to reduce consumer spending.
The Q1 GDP was weighed down by inventories but counterbalanced by the resilience of consumers. The decline in inventories drove down the GDP by 2.3 percentage points and is a trend we expect to continue as consumer demand wanes. However, real final sales to domestic purchasers increased by 2.9% in Q1, emphasizing that the economy remained resilient. Consumer spending growth was strongest in the beginning of Q1 and slowed by quarter-end, with slight increases in business investment and government spending. We expect that growth will slow sooner rather than later in the economic sectors that are most sensitive to interest rates going forward.
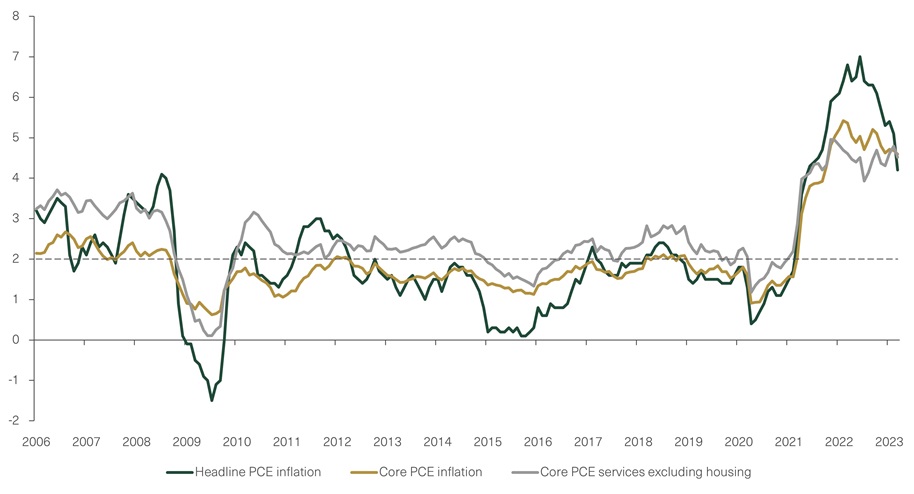
Within the GDP release, headline personal consumption expenditure (PCE) inflation, a measure of consumer spending on goods and services, was stronger than expected for Q1. The headline PCE rose by 4.9% year over year (YoY) in Q1. Core PCE inflation, the preferred measure of inflation of the Federal Reserve (the Fed), rose by 4.9% QoQ after rising by 4.8% in Q4 2022 (see Figure 2). This confirms that inflation remains too high for the Fed, which will raise rates next week. Weakness in consumer spending came to a standstill at the end of the quarter, and we expect consumer spending to further slow as high interest rates, tighter lending standards and high inflation take a toll on purchasing power.
Spending on durable goods was stronger than expected in March, as durable goods rose by 3.2% MoM, after falling by 1.2% the prior month. Durable goods orders were driven higher by increased orders in transportation, with a 55.6% increase in aircraft orders that offset the decline in the prior two months. Goods orders, excluding transportation, point to weaker growth, rising by only 0.3% MoM in March. We expect durable goods orders to decline going forward given their sensitivity to credit conditions, which we expect to remain tight.
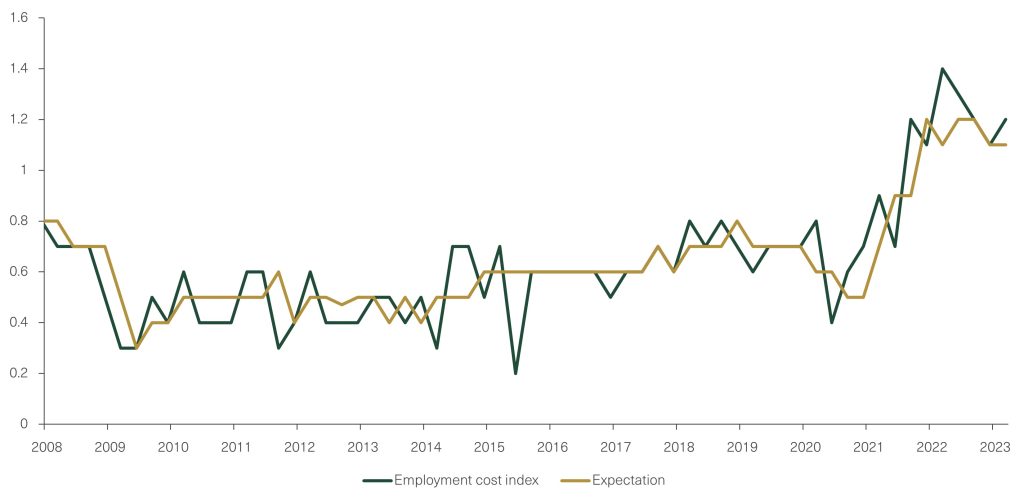
The Employment Cost Index (ECI), which measures the changes in the cost of employees to employers, rose by 1.2% in Q1, more than expected, and by 4.9% YoY (see Figure 3). This increase was driven by a rise in benefit costs, wages and salaries. Compensation costs moderated YoY but remain too strong for the Fed. We expect compensation growth to slow going forward as economic growth will also likely slow. The rise in the ECI, in addition to resilient consumer demand despite high prices, adds pressure on the Fed to raise rates again next week in order to lower inflation near its 2% goal. All eyes are on the Fed’s decision at the Federal Open Market Committee (FOMC) meeting next week.
First-quarter earnings update
Corporate earnings have so far exceeded downbeat projections to a surprising degree, with 64% of S&P 500 market cap having reported. Earnings for the S&P 500 are tracking to decline by 4.5% on a YoY basis, which by most standards would be disappointing but represents an upside from what was feared to be a decline of 8.1% just weeks ago. Over 80% of companies have beaten earnings projections, which is the largest share since 2021, while 66% have exceeded sales estimates. The positive momentum has been broad-based across nearly all sectors. Despite the higher-than-expect earnings beats, the market reaction to the results has been skewed toward the downside as opposed to the upside, with little to no average reward for companies that have exceeded expectations but a harsh average reaction to those companies that have missed them. In summary, while many analysts expected Q1 to be a watershed bottoming of corporate earnings, so far results show that unlikely to be the case.
Going forward
Equity and bond markets will suffer through pockets of elevated volatility until there’s a meaningful and consistent decrease in inflation, and the duration of higher rates is more certain as markets become comfortable with a “data-dependent” Fed that’s now focused on the cumulative effects of rate hikes. We remain defensive in our positioning, and we’d look for opportunities to upgrade portfolios during market weakness.
Within equities, we continue to favor U.S. Large Cap exposure, since China’s evolving COVID policies continue to weigh on manufacturing and growth. We’ve recently become more constructive on Developed International equities, as the energy recession wasn’t as severe as anticipated. In the United States, large-cap equities provide an attractive blend of quality, yield and growth at a reasonable value, albeit at higher valuations, as earnings expectations continue to deteriorate. For fixed income, we recommend a barbell positioning, with an overweight to short- and longer-dated bonds. We remain defensive in our credit positioning and higher in credit quality. We expect that credit spreads will leak wider to account for slowing growth and recession risks.
THE WEEK AHEAD
- March’s final durable goods orders are expected to increase by 3.2% MoM and will be released on Tuesday.
- April’s Institute of Supply Management (ISM) Manufacturing Index is expected to increase to 46.7 and will be released on Tuesday.
- April’s ISM Services Purchasing Manger’s Index is expected to increase to 51.7 and will be released on Wednesday.
- At the FOMC meeting next Tuesday and Wednesday, the Fed will provide more details about upcoming changes to monetary policy.
- April’s nonfarm payrolls are expected to rise by 185,000 and will be released on Friday.
- April’s unemployment rate is expected to remain unchanged at 3.5% and will be released on Friday.
Figure 1: U.S. real GDP growth: Q1 2023 (percentage contribution to GDP growth)
Sources: Bloomberg, as of April 28, 2023.
Figure 2: The Fed’s 2% inflation goal is unlikely to be reached any time soon (percentage)
Sources: Bloomberg, as of April 28, 2023.
Figure 3: Employment cost index vs. expectation (percentage)
Sources: Bloomberg, Bureau of Labor Statistics, as of April 28, 2023.
Market Returns (USD) as of 4/27/2023
| 1-Week | Quarter-to-Date | Year-to-Date | 1-Year | |
|---|---|---|---|---|
| Global Equities | ||||
| MSCI All Country World | -0.4% | 0.7% | 8.1% | 1.3% |
| S&P 500 | 0.1% | 0.7% | 8.3% | 0.6% |
| Dow Jones Industrial Average | 0.1% | 1.8% | 2.7% | 3.8% |
| NASDAQ | 0.7% | -0.6% | 16.3% | -1.9% |
| Russell 2000 | -2.1% | -2.8% | -0.1% | -5.6% |
| Russell 1000 Equal Weighted | -1.0% | -1.9% | 1.0% | -5.8% |
| MSCI EAFE | -0.5% | 2.3% | 10.9% | 9.5% |
| MSCI Emerging Markets | -1.8% | -1.7% | 2.2% | -4.2% |
| Fixed Income | ||||
| ICE BofAML Municipals 1-10 Year A-AAA | 0.0% | -0.3% | 1.6% | 3.0% |
| Bloomberg Barclays Intermediate Government/Credit | 0.1% | 0.2% | 2.6% | 0.1% |
| Bloomberg Barclays High Yield Bond | 0.3% | 0.7% | 4.3% | 0.3% |
Market Levels
| Thursday | Week Ago | Year End | Year Ago | |
|---|---|---|---|---|
| S&P 500 | 4135.35 | 4129.79 | 3839.5 | 4183.96 |
| Dow Jones Industrial Average | 33826.16 | 33786.62 | 33147.25 | 33301.93 |
| 10-Year U.S. Treasury Yield (Constant Maturity) | 3.53% | 3.54% | 3.88% | 2.81% |
| Gold ($/oz) | $1,988.01 | $2,004.80 | $1,824.56 | $1,885.60 |
| Crude Oil ($/barrel) | $74.76 | $77.37 | $80.26 | $102.02 |
| U.S. Dollar / Euro ($/€) | 1.1 | 1.1 | 1.07 | 1.05 |
| U.S Dollar / British Pound ($/£) | 1.25 | 1.24 | 1.2 | 1.25 |
| Japanese Yen / U.S. Dollar (¥/$) | 134.13 | 134.24 | 131.95 | 128.33 |
| Bitcoin Futures ($/XBT) | $29,690.00 | $28,203.91 | $16,498.08 | $38,900.00 |
Sources: Morningstar, FactSet
All analyses and projections depicted herein are for illustration only, and are not intended to be representations of performance or expected results. Past performance is not a guarantee of future results.
Investors cannot invest directly in an index. The indexes referred to do not reflect management fees and transaction costs that are associated with some investments.
Investors should seek financial advice regarding the appropriateness of investing in any securities, other investment or investment strategies discussed or recommended in this report and should understand that statements regarding future prospects may not be realized.
Although information in this article has been obtained from sources believed to be reliable, we do not guarantee its accuracy, completeness or fairness, and it should not be relied upon as such.


